This is a quick overview of the new control features since they differ from the old chart.
New Graph Points Detailed Information
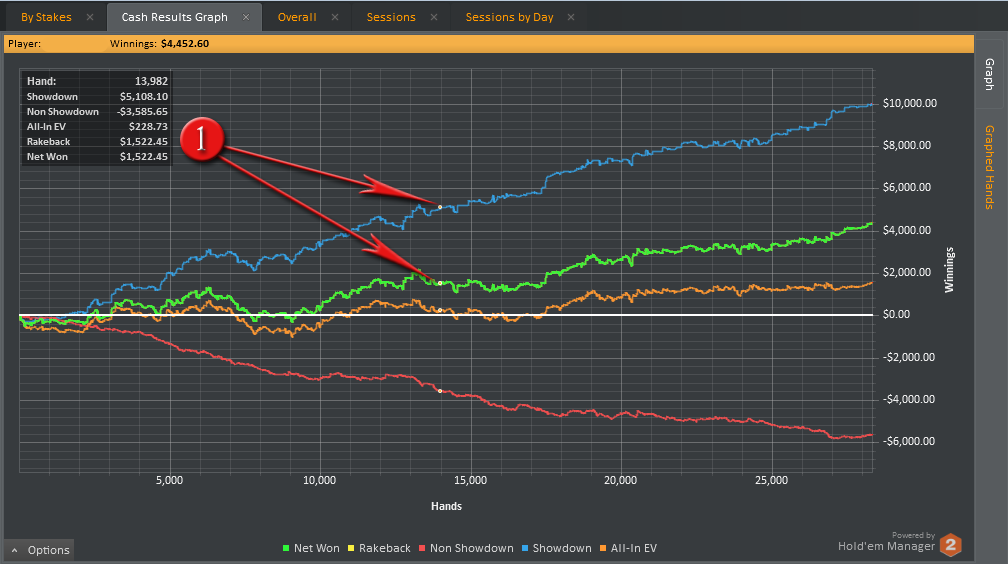
1 - First as you hover over a point in the graph youll notice is displays detailed info on the hand number, EV, winnings and rakeback. This is based on the exact point your mousing over in the graph.
Zooming In
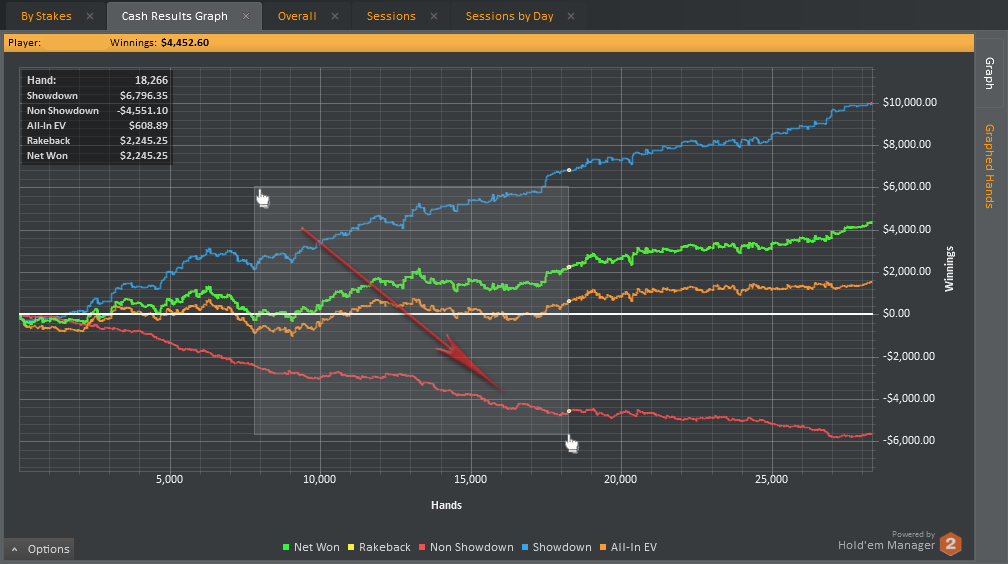
2 - To zoom in on a hand just left click and drag from the starting point to the end point. You will see the shadowed overlay as you drag, when you release the left mouse button it will display that zone within in the overlay.Once zoomed in on a group of hands you can click on the "Graphed Hands" vertical tab on the right side of the graph to view the hands you zoomed in on.

Panning and Zooming Out
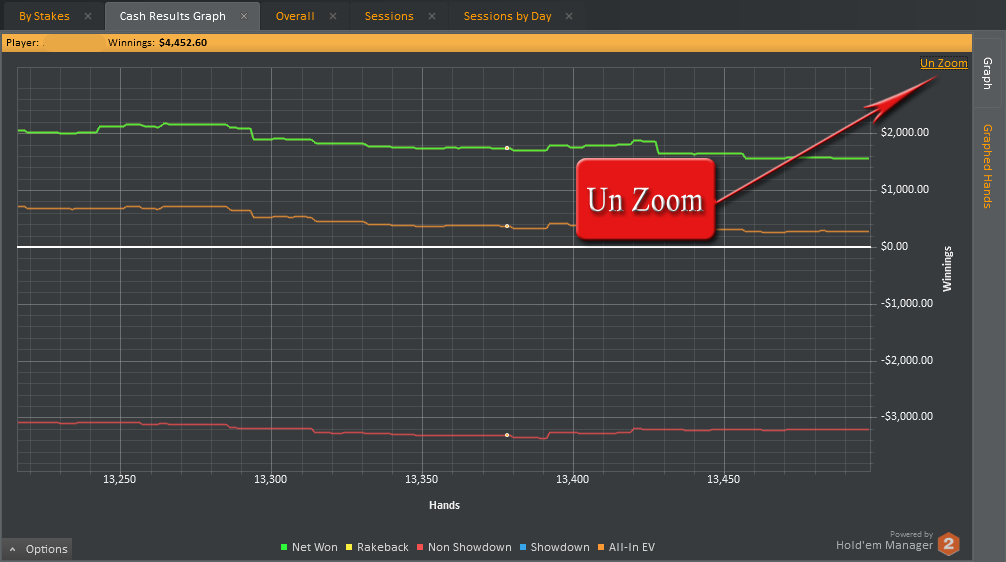
To pan/move left to right use the right click button and hold it while you move left or right. Once zoomed in if you would like to zoom back out you can do so using the zoom button on the top right of the graph. This becomes visible once you zoom in.
Options:
As with the previous graph control you also have the various options to group by month, day, untick or tick rakeback, EV etc in the options on the bottom left.
Saving an image of the graph - You can save an image of the graph by clicking on the options in the bottom left corner of the graph and choose the save or print friendly save options


 The article has been updated successfully.


