Brand new for Holdem Manager 2 are graphs/charts for the HUD.
- Session Won Loss shows overall winrate in the session. See if someone is possibly tilting from recent big losses.
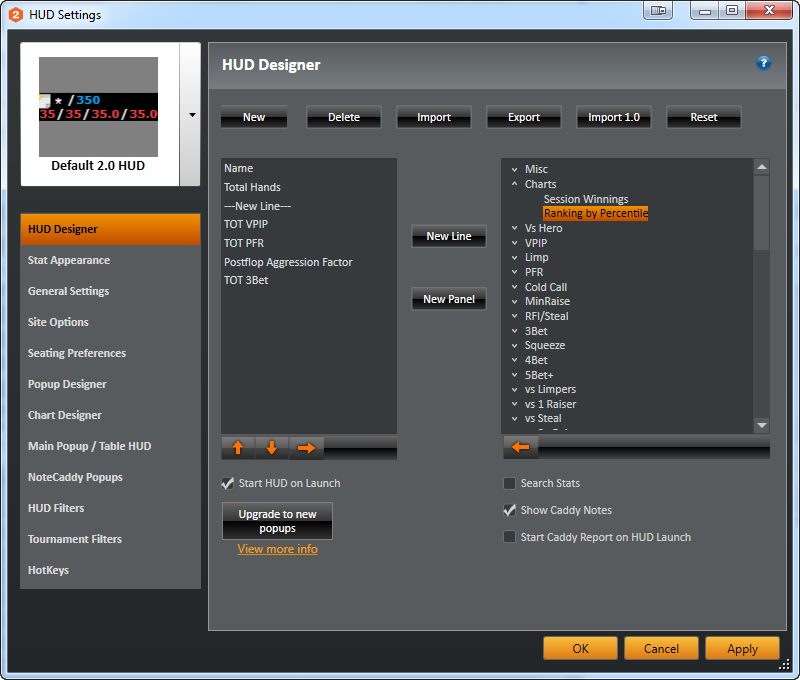
- Percentile Ranking shows key stats that are setup in a bar graph format.
Adding Graphs To Your HUD
Chart Designer
Adding Graphs To Your HUD:
Pick the Graphs HUD or...Go to HUD Settings / Displayed Stats and under the "Charts" heading on the right to select from two different types of Charts.

Chart Designer:
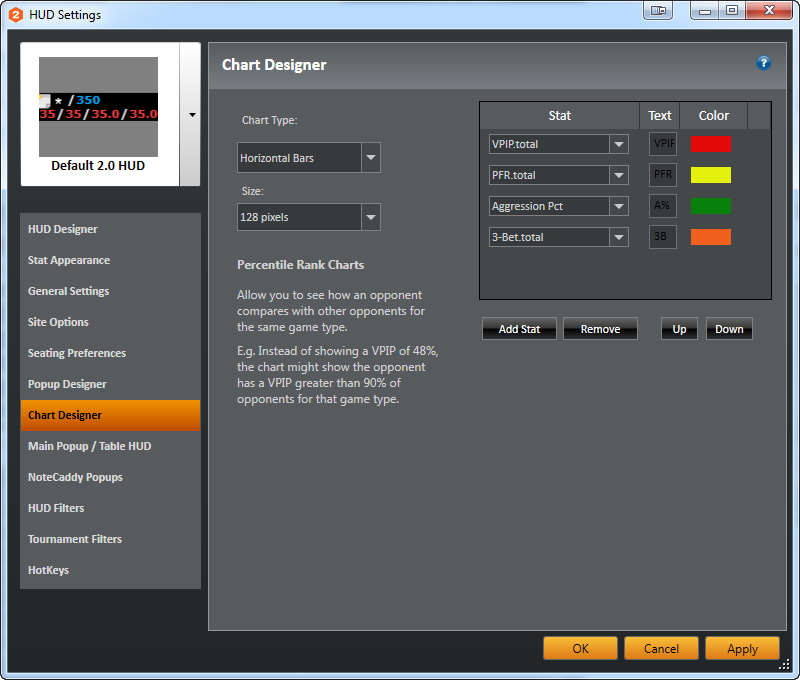
Use the Chart Designer to customize what type of graph, stats, text and color are displayed in the HUD.
Chart Type:
- Horizontal Bars
- Bars From Origin
Bars From Origin display vertical bars.
Remember, 50% is average. Anything out of that range means the player does this action more frequently or less frequenlty than the average player. Low bar chart = less. Big bar chart = more.
Size:
Choose the size of the chart to be displayed on the HUD. (64 pixels is default)
Available Stats:
- VPIP
- PFR
- 3-Bet
- Aggression Percent
- Won $ Saw Flop
- Went to Showdown
- Won$ Showdown
- C-Bet Flop
- C-Bet Turn
- C-Bet River
- Fold to Flop CB
- Fold to Turn CB
- Fold to River CB
- Squeeze
- Open 4-Bet
- Cold Call 3-Bet
- Fold to 3-Bet
- Call 3-Bet
- 4-Bet
Text:
Enter the text for that line on the charts.
Color:
Changes the color of the chart bar


 The article has been updated successfully.


