What are NoteCaddy Spark Graphs?
Answer:
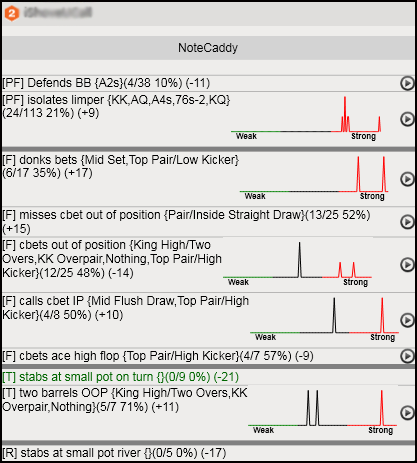
Spark graphs help us visually gauge the range of hands to help identify what percentage of hands are weak, mediocre or strong.

Each Spike represents a hand and the placement on the graph determines the strength of that hand. The left side of the graph, which is highlighted in green, shows the weak hands. The further to the left the spike is, the weaker the hand is. A hand on the extreme left would be a 72o type hand. Whereas a hand on the extreme right would be AA. Progression to the right means the strength starts to increase. The middle of the graph represents mediocre hands that can not be defined as either weak or strong. This is quite useful to gauge what percentage of the villain's range is strong, weak or mediocre.
Where can Notecaddy spark graphs be used?
Notecaddy spark graphs can be found in the Hand Viewer and in the HUD popups.Spark Graphs - Hand View
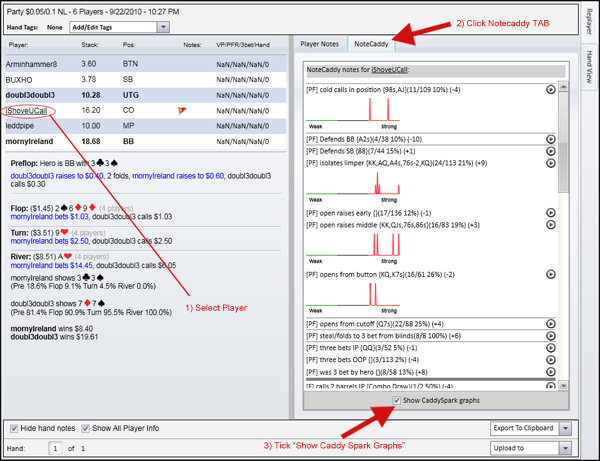
Click on a player in the hand view. Then click on the Notecaddy Tab. It will display the automated notecaddy notes for that player.The Notes are divided up by street and displayed in order from preflop to river. If a player has a spark graph associated with any of his stats, then the "Show CaddySpark Graphs" tickbox will appear at the bottom. Once this is ticked, the spark graphs will appear under the notes like shown below:

Spark Graphs - Hud Popup
When using the HUD, either in the replayer or playing live, hovering over the notes icon in the HUD will display the notes and notecaddy popup. Replay the hand in the Replayer by pressing the play button. It will load all the hands in the Replayer that are associated with that note. In the example below is a player with several notes.


 The article has been updated successfully.


